Louisiana Tech baseball last year went 42-20 and received an invitation to play in the Starkville Regional for the postseason. It was a much more successful year for the Bulldogs than anybody had predicted. This year, Tech hoped to build off that success with goal of making it to Omaha this year. Even though Coach Goff left to coach at Alabama, Tech retained much of its player talent, so the expectations were high.
The season got off to a fantastic start, a 15-2 record with wins over Arkansas, ULL, and a series sweep of Wichita State. But then the slump happened. Many fans are now questioning whether this team is really as good as they were expected to be. So let’s look at some numbers.
Wins
Wins: The all important stat in any sport. At 30 games into the season, the Bulldogs are 19-11, or 8 games above 500. At 30 games last year, the team was 18-12: 6 games above 500. So the 2017 team has the better record at this point in the season. But let’s look at how the record has changed over the year.
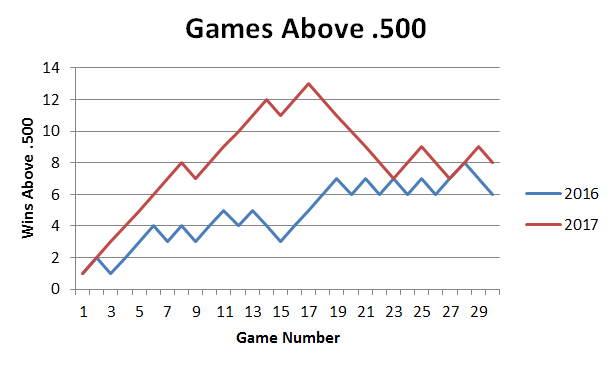
Because of the early winning streak(s), the 2017 Dogs have consistently had a better record than their 2016 counterparts. The graph very visibly shows the slump, but also a possible sign of hope. Tech has gone 4-3 since it broke its six game losing streak. That’s not a great record for a seven game span, but the early part of the slump was much worse.
Runs Scored
Right now, Tech is 18th in the country at scoring runs per game, with 7.7 RPG. Last year, they finished at 52nd in the country with 6.5 RPG. However, just looking at the games since the slump started on March 17th, Tech is only scoring 5.9 runs per game. That amounts to about 100th in Division 1 baseball. There are some decent teams that can afford to only score 5.9 runs a game (for example Arkansas and #1 RPI Oregon State), but they rely heavily on their pitching staff.
One excuse many have for this abysmal not good RPG is how many runners Tech is leaving on base. This will be discussed in more detail in the next post, but in the slump Tech is only scoring 31% of its base runners (LOB%), as opposed to the 45% on the year. So this means that on the year about half of all players that get on base would score, but now that number is under a third. Last year, the LOB% was 38%. So this year’s Tech team is much better at scoring runs, but the slump is dragging that percentage down.
Runs Against
Another common justification for the slump is the pitching. Last year Tech’s pitching staff had a group ERA of 3.77, or 57th in the nation. This year has recorded an ERA of 4.37, 121st in the country. The Bulldogs weren’t especially dominant in the pitching department last year, but it was certainly serviceable. This year, if the bats go cold (like they have often in these past few games), the pitching isn’t enough to keep them in the games.
Coach Burroughs knows this is a problem and taking steps to address it. Nate Harris (Tech’s only dominant pitcher at the moment with a 0.76 ERA) has been taken out of the bullpen and put into the starting rotation. After a full game shutout this past weekend, the experiment seems to be a step in the right direction. Unfortunately, Tech will need more than just Harris to bring its pitching staff to form.
Conclusion
The Tech team playing right now looks very similar to the 2016 team at about this time of year. If Tech can recreate what they had in the beginning of this year and play with it for the rest of the year, they are in very good shape. That is easier said than done, but Tech showed early on what kind of team it could be.
To finish, its worth mentioning that it wasn’t the first half of the year that got 2016 Tech to the NCAA Regionals. The Bulldogs went on 19-4 run to close out the regular season. The first win of that run? The 31st game of the year.
