Often, if you follow the baseball team on twitter, you will see a tweet like this:
T1 | Diaz draws a walk to open the ball game!
— Diamond Dogs (@LATechBSB) April 15, 2017
followed shorty with a tweet like this:
M1 | Diaz is stranded. Cam Linck ready to make his eighth start of the year.
— Diamond Dogs (@LATechBSB) April 15, 2017
During the slump, many people *(cough cough BBB)* blamed this inability to score base runners as the main problem for the under-performance of the team. There was a lot of anecdotal evidence thrown around, but what do the numbers say? How bad has Tech been this year at scoring runners?
Just to clarify a bit, a runner left on base is a player that gets on base via hit or walk that never gets called out but also doesn’t score. So if Player A singles with two outs, but the next batter strikes out, Player A is a runner left on base. But if Player A singles with one out and nobody on base, but the next batter hits into a double play, Player A is not considered a man left on base because he was one of the two outs in the double play.
Runs
So before we look at more advanced stats, lets look at a basic one: runs. On the year, Tech has scored 262 runs, good for 28th in NCAA baseball. In C-USA, only Southern Miss and Florida Atlantic have scored more. It’s a definite improvement over finishing in 42nd place in college baseball last year. But has leaving runners on base held Tech back from what they could accomplish?
LOB%
Unlike in the MLB, college baseball scorekeepers do not record the number of players left on base at the end of a half inning. So we need to calculate it ourselves. Luckily there is a formula: LOB% = (H+BB+HBP-R)/(H+BB+HBP-(1.4*HR)). Usually this stat is used to evaluate pitchers and their effectiveness, but we will use it to look at a team’s offensive production.
Using that formula, Tech’s LOB% is 62.39%. So, about 62% of the time, when a batter gets on base, they do not score. So conversely, if a runner gets on, they will score 38% of the time. But is that good? How does that stack up against the competition?
Against C-USA

So this is the 1-LOB% for each member of C-USA. This is 100% minus the percentage of base runners left on base, so it is the percentage of base runners that score. So high numbers are good.
With the exception of WKU and Rice, these numbers are very close. Tech is currently 5th in C-USA, behind ODU, Southern Miss, Charlotte, and Middle Tennessee. All four of which are decent or better programs. Tech and FAU are almost identical, and FAU is arguably the second best team in C-USA this year.
But let’s provide some context. Here is a comparison of 1-LOB% to RPI:

It got a little tight in the top right, so here is a zoom in on that section of the graph. WKU really throws off the scale of the chart.
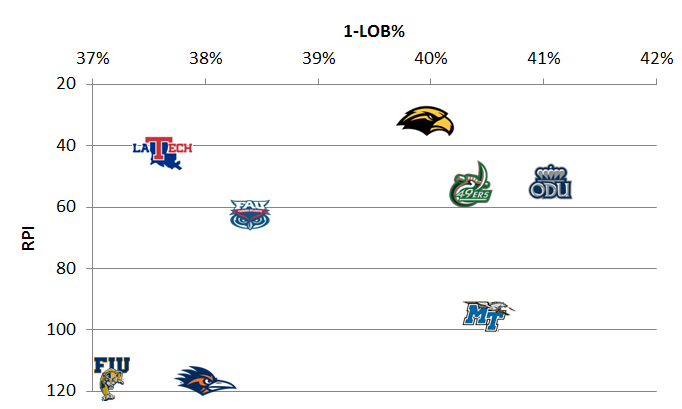
As you can see, it’s not a 1:1 ratio, but the better you are at scoring base runners, the better you do on the year. Or at least until a point. Being only C-USA schools, its a small sample, but teams with over 37% (the zoomed in graph) are a mixed bag of success. Middle Tennessee has a higher 1-LOB%, but a much lower RPI. Southern Miss is the highest ranked team in C-USA, but ODU has a much higher 1-LOB%.
RPI factors in the whole team, however. So bad pitching will drive a team’s RPI down, even if it has a competent offense. So let’s just compare 1-LOB% to runs scored:

Here we see a closer correlation of data (exponential R² value of .7248 rather than .5064 for the RPI graph). So it is safe to say a higher 1-LOB% indicates a better offensive performance.
Conclusion
Tech’s LOB% matches that of a good baseball team. It could be higher, but it is not what is holding Tech back from being the team that it was when it finished last year. In fact, it is not the offense at all that is holding Tech back, it is the pitching. I’ll take a look at what’s happening with pitching next week.