
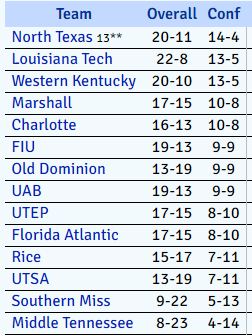
Going into the C-USA tournament last year, it finally seemed like everything was coming together. The Bulldogs were only one game out of first place, a position held by North Texas, the team the Bulldogs had defeated in Denton only a couple of weeks before.
With a first-round bye, Tech only needed three straight wins in Frisco to clinch an NCAA tournament berth. Of course, we’ll never know if the Bulldogs would have actually done it (basketball tournaments typically only bring Tech fans pain), but many expected the Championship game to be a rematch of Tech and North Texas, the two highest-ranked teams in both the KenPom and Massey computer polls.
But like the rest of the college basketball universe, Louisiana Tech ended their season without knowing the heights they could reach. Were we robbed of the year that was going to finally break the 29-year-old NCAA tournament drought?
And going into this year, the Bulldogs faced another challenge. DaQuan Bracey, the face of the franchise for the past four years, had graduated. Hefty contributors like Derric Jean, Mo Muhammed, and Oliver Powell were out too. Nobody would be surprised if the Bulldogs took a step back this year.
So that’s what I want to figure out: how does this team compare to last year’s?
Because of the shortened out-of-conference schedule this year, we’ll only have nine out-of-conference games this season to compare to the full 30-game schedule last year.
But just because it’s been a shortened season, doesn’t mean it hasn’t already had its ups and downs.
The Bulldogs were dominated by LSU, collapsed at Louisiana-Lafayette, but won every other game, even when the team tried really hard not to. Just like we saw in Tech’s 11-point squeaker of a win over #296 ULM, the Bulldogs have often struggled against inferior opponents.
But rather than talk in broad strokes, let’s key in on a few stats and see how this 2020-21 Bulldog basketball team compares to its previous version. And of course, we’ll start with free-throw shooting.
Free Throws
As a team, things are almost hilariously identical from this season to last. Last year, the team shot 66.4% from the free-throw line, 312th “best” in the country. This year, it’s 66.3%.
But there’s good news and bad news. The good news is that Bracey’s 51% FT shooting is finally off the books. The bad news is that Tech’s best free-thrower (is that a word?) has been slumping so far this year:
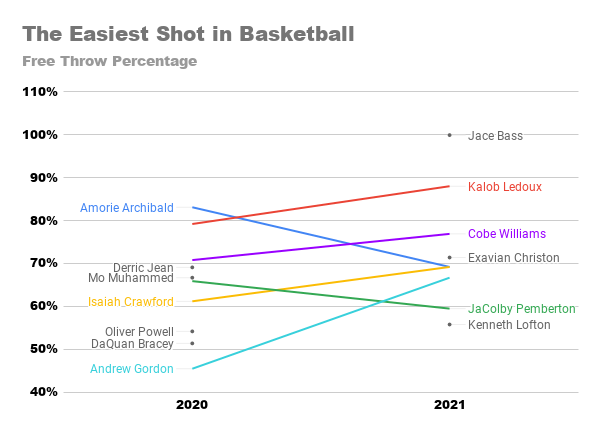
(Exavian Christon is treated as a new player this year as he played infrequently last year).
Newcomer Jace Bass’s perfection is great to see (even if it comes on only six attempts) and Andrew Gordon’s improvement at the line is also worth highlighting. Gordon has gone from liability at the line, to a just-below-average free throw shooter. It’s almost inspirational enough to make a Disney+ movie about.
But if Archibald is able to return to his career average (and Gordon’s turnaround hasn’t been a fluke) we may actually see Tech become an average free-throw shooting team. What a world that would be.
Now to the two most important stats in basketball: turnovers and rebounds.
Turnovers
As a team, the Bulldogs have improved year-over-year when it comes to giving the ball away. Last season, the Bulldogs ended 18.5% of their possessions with a turnover. This year, that number is all the way down to 17.9% (a whole 0.6% less!). But that slight improvement does put Tech in the top 100 in college basketball.
For the individual players, we’re going to use a KenPom stat called Turnover Rate (TORate). TORate compares how often a player turns the ball over compared to how often they put up a shot.
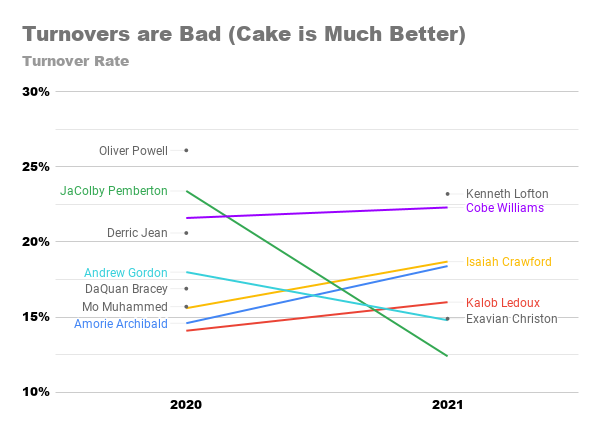
Lower numbers are better here because turnovers are a bad thing (even the Arby’s ones, fight me). Most of the returners have a TORate similar to what it was a year ago, but Jacoby Pemberton has improved from one of the worst offenders on the team to the most trustworthy with the ball in his hands.
Defensive Rebounds
It’s fitting that we ended the last section singing praises of Pemberton because he deserves another shout-out for his improvement on the defensive boards:
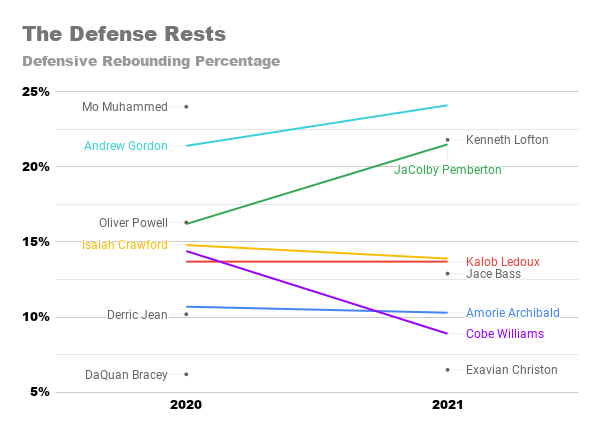
Defensive rebounding percentage (DR%) measures the percentage of possible defensive rebounds that the player comes down with. So for example, when the opposing team misses a shot when Pemberton is in the game, he grabs the rebound 22% of the time.
A worry heading into this season was how Tech was going to make up for was the loss of Mo Muhammed, the 75th best defensive rebounder in the country last year.
Pemberton and Gordon have improved to compensate for Mo’s departure, but true freshman Junior Lofton has put up stellar rebounding numbers, even if Lofton is currently only the 197th best defensive rebounder in the country (what a scrub!).
Offensive Rebounds
We’ll end this post with rebounding on the other side of the court. Offensive Rebounding Percentage (OR%) is identical to DR%, but with rebounds on shots that Tech misses.
As you might expect, there aren’t as many offensive rebounds in a game, and when they are grabbed, it’s often by the tallest players on the court:
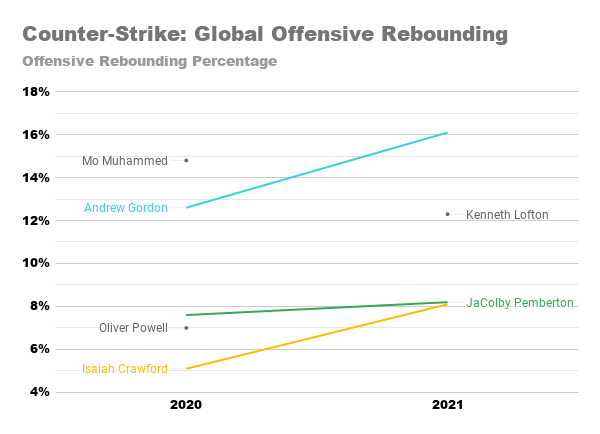
This was another area Mo Muhammed dominated last year, and another area where Andrew Gordon has picked up some of the slack. But Tech’s other tall returners (Pemberton and Crawford) have also improved from last year. A chart where all the lines are moving up and to the right is a good chart!
Conclusions
It’s still very early in the season, and Tech starts their conference slate against two of the best teams in C-USA. In a year where Tech has a lot to replace, it’s nice to see returners step up alongside newcomers like Junior Lofton.
If football was an indication, this covid-shortened season may be a wild ride, but there’s still room for basketball-related optimism in Ruston, Louisiana.