
Before the start of last season, I wrote a piece called “Do We Want J’Mar?” The idea was to try to judge what we can demand expect from J’Mar in 2017 based on his performance in the 2016 Arkansas game. Now that we have a full season of data from J’Mar, we can take a better look at Tech’s starting QB.
J’Mar Smith’s Wild Ride
If we were to sum up J’Mar’s 2017 season with one word, we’d probably settle on “inconsistent.” At his best (like against SMU), J’Mar Smith looked elite. In that SMU game, the Mustangs had their own set of problems, but J’Mar and Tech’s offense drove the ball at will.
J’Mar’s worst, however, was pretty awful. In games against Mississippi State and Southern Miss, J’Mar couldn’t find the endzone, but had a knack for finding a defender’s hands. (That’s just my fancy way of saying he threw an interception in each game.)
Turnovers weren’t J’Mar’s only issue. In the games against Mississippi State and USM J’Mar’s completion percentage was 43.5% and 39.3%, respectively. To put that in perspective, no starting Tech QB had a single game completion percentage below 45% since Cody Sokol in the game that definitely never happened 2015 C-USA Championship game in Huntington, Worst Virginia.
Interestingly, those two contests that J’Mar struggled in were against teams in his home state of Mississippi. I’m not saying J’Mar has so much state pride that he intentionally threw games to allow Mississippi teams to win. But I saying I am surprised I never saw that particular conspiracy theory on BBB.
So let’s map out J’Mar’s Quarterback Rating over the course of the twelve regular season games. Unsurprisingly, you get a chart that looks like a pretty fun roller coaster:
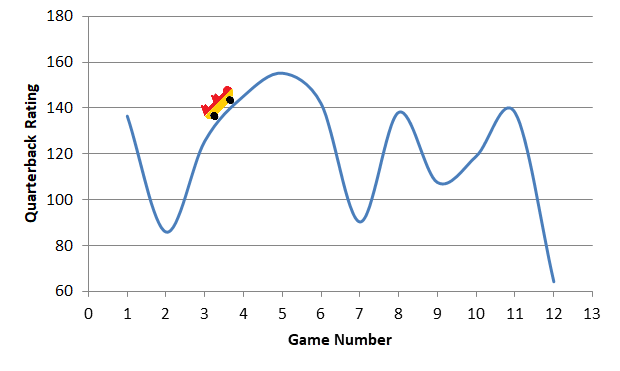
Game 2 was Mississippi State, a loss. Game 7 was also a loss to USM. But Game 12 was UTSA, a game that Tech won, oddly enough. So let’s look at a comparison between those three games:
| CMP% | TD | INT | |
| Mississippi St | 43.5 | 0 | 1 |
| Southern Miss | 39.3 | 0 | 1 |
| UTSA | 33.3 | 0 | 1 |
That game against the Roadrunners marked the third time J’Mar’s completion percentage dropped below 45%. The last time that happened to a starting Tech QB, I had just entered high school (Ross Jenkins in 2008). You’re allowed to call me a whippersnapper now.
But the roller coaster graph from above is missing one very important game: the 2017 Steak and Shake Frisco Melt Bowl. When you add it, the roller-coaster gets a lot less….safe:
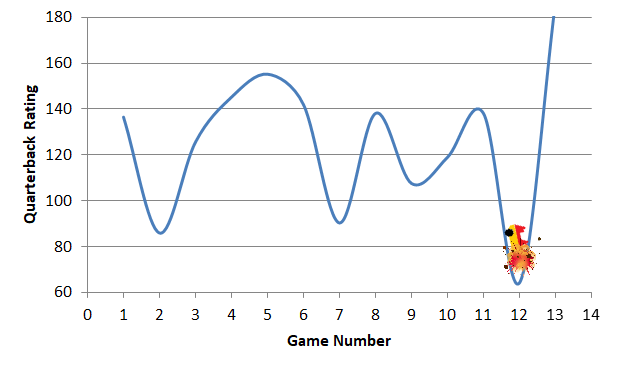
The tragic death of everyone on that train car illustrates the fact that J’Mar ended the season with his worst game followed by his best game.
At the start of Ryan Higgins’ senior campaign, the QB had his own share of ups and downs. So much that there was a phrase created for it:
I want to get off Ryan Higgins' Wild Ride
— Daniel Adams (@ManieltheDaniel) October 24, 2015
Last year, we got a chance to catch a glimpse of J’Mar Smith’s Wild Ride™. Now the question is if J’Mar’s ride will even out over time or we should count on another roller coaster of a season.
Switching Stats
I’m going to try to predict what we got from and what we can expect from J’Mar by comparing him to other C-USA QBs. In the previous charts, I was using a stat called Quarterback (or Passer) Rating.
The NCAA formula for Quarterback Rating is:

The issue with the formula is that quarterbacks don’t just pass the ball, especially in the college game. So ESPN created a stat called “QBR” that also takes rushing stats into account.
QBR stands for “Quarterback Rating,” but it’s not the same “Quarterback Rating” as the one we were using earlier. I know it’s confusing, but don’t blame me. Do what hockey fans do for most things and blame ESPN.
To add to the confusion, there are two versions of QBR: Raw and Adjusted. The Raw QBR does not take into account the strength of a defense, so I’m using the Medium Rare Adjusted QBR.
Below is a chart that compares the two stats. Although the values are lower for the QBR stat, the two lines look very similar (this is a good thing!)

With that out of the way, we can start comparing J’Mar to some other QBs.
Comparison to C-USA
Okay, so I want to preemptively apologize for the mess that is this next chart.

Originally, I also had a line for every QB in C-USA, but it just looked like ULL a complete mess. So I simplified the chart to just show the most popular C-USA QBs.
It’s still pretty busy, but you can see that each of the four quarterbacks had an up and down season. All four had peaks and valleys throughout the season. Excluding former Tech basketball coach Western Kentucky QB Mike White’s middle stretch of seven games, no QB had a consistent QBR for more than two games.
The above graph gives a decent impression of the consistency of the QBs, but it’s still difficult to compare them. So we need something better.
In 1969ᴺᶦᶜᵉ, the wonderfully-named mathematician John W. Turkey invented the best chart type ever. I present to you the box and whisker plot:

Damn, that’s a sexy chart format.
If you need a refresher on how to read these types of charts, here’s a handy guide:
First, let’s look at the entire span, from whisker tip to whisker tip. As we’d expect, J’Mar was more inconsistent overall than Mason Fine or Mike White. But surprisingly, J’Mar was more consistent than the QB of the C-USA champion FAU. Jason Driskel has a high above J’Mar’s highest and a low below J’Mar’s lowest.
Mike White was has the smallest whisker span, but that’s expected of a quarterback that played college ball for sixty-five years.
But let’s look at just the pretty colored boxes. Both halves of the box combined counts for 50% of the games played by each QB. Of the four players above, J’Mar has the smallest box.
In the sport of figure skating, the highest score and lowest score are dropped and the remaining scores are kept. If we take a page from the first Winter Olympic sport and throw out the top three games and bottom three games (so like half the season), J’Mar is the most consistent QB in Conference USA.
Conclusion
We have found that J’Mar was more inconsistent than his peers in C-USA. J’Mar was not the most inconsistent (thanks, Jason Driskel!), but he had more ups and downs than the typical C-USA QB.
But despite this, even the best C-USA QBs are inconsistent to a degree. Mike White was Mr. Consistent, but even he had a 60 point difference in QBR between his best and worst games.
So while J’Mar was more irregular than the top tier of QBs we looked at, it wasn’t by a drastic margin. And making things better, J’Mar went into the year with only one full game of experience, while Mike White was a senior citizen and Jason Driskel was a junior.
There were a lot of ups and downs, but that is to be expected from a QB in that position. Especially with the expectations placed on his shoulders to follow up his Fayetteville performance.
J’Mar was on the right track last year. He wasn’t perfect, but he performed as well as should be expected of a player who couldn’t have a legal drink until halfway through last season.
Now the question is, what will “We Want J’Mar Part III: Funny Title Placeholder” be about? J’Mar’s continual struggles with consistency? Or J’Mar’s shiny new Heisman trophy? There is no in between.
Pingback: 2018 gtpdd Season Preview – gtpdd
Pingback: Hoops Check-in: Mythical Beasts and How to Beat Them – gtpdd